
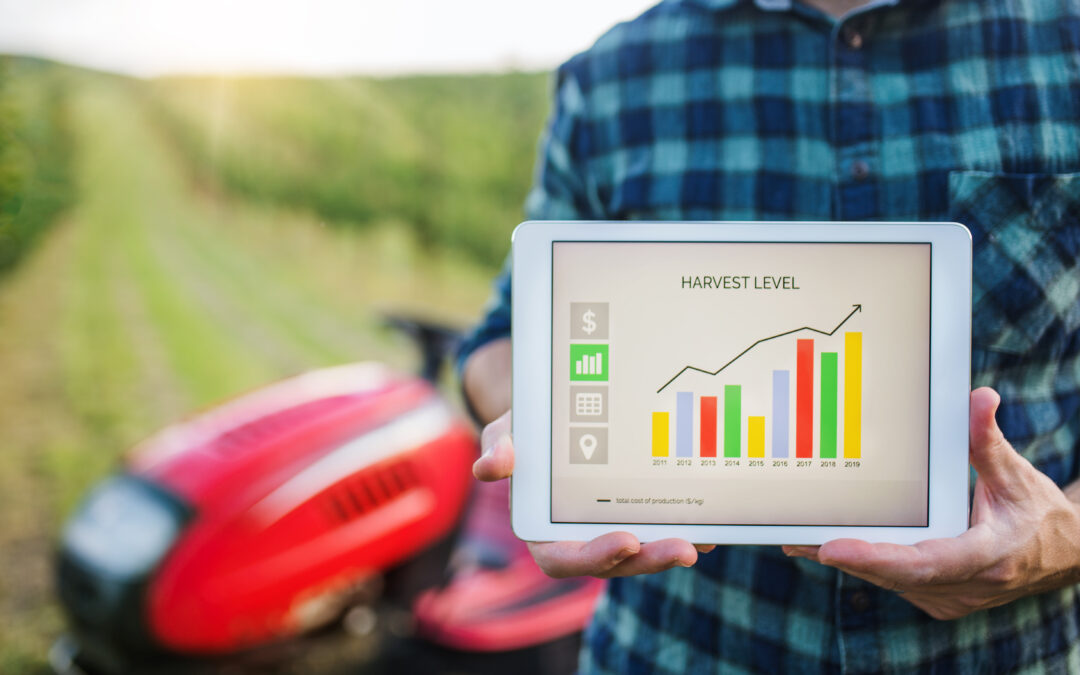
Harvest is the culmination of months of decisions. Seed selection, planting population, fertilizer applications, crop protection, weather conditions, and field management all contribute to the final result that enters the combine.
But harvest does more than reveal how many bushels a field produced.
Modern precision agriculture equipment can collect an enormous amount of harvest data as the combine moves through the field. Yield, moisture, location, and other information can be recorded and mapped, giving farmers a much more detailed picture of field performance than a simple whole field average.
The real value of that information comes from what happens after harvest.
When accurate harvest data is compared with soil tests, planting information, application records, weather, and field observations, farmers can begin identifying patterns that may help guide decisions for the following growing season.
From fertility and seeding decisions to variable rate applications and field improvements, information collected this fall can become an important planning tool for next year’s crop.
Harvest Data Shows More Than Average Yield
Knowing the average yield of a field is useful, but an average doesn’t tell the entire story.
Consider a field that averages 200 bushels per acre. Some areas might consistently produce well above that average while others produce significantly less.
Looking only at the average hides those differences.
Yield monitoring and mapping allow farmers to see where production changes throughout the field. Those patterns can help identify areas that deserve additional investigation.
University of Nebraska Lincoln Extension describes yield maps as valuable spatial information that can help investigate yield limiting factors and support site specific crop management.
The important part is determining what caused those differences.
Harvest data identifies where performance changed. Soil tests, scouting records, topography, drainage information, and other field data can then help determine why.
Start With Accurate Harvest Data
Before using harvest information to make decisions, farmers need confidence in the quality of the data.
Yield monitor calibration is critical.
An improperly calibrated system can produce inaccurate yield numbers and misleading maps. Iowa State University Extension notes that fertility planning, hybrid selection, variable rate planting, and other management decisions may rely on yield information, making proper calibration an important part of collecting useful data.
Yield monitors should be calibrated according to manufacturer recommendations, and farmers should monitor system performance throughout harvest.
Changing moisture levels, crop conditions, sensor problems, and other factors can affect accuracy.
The goal shouldn’t simply be to collect as much information as possible.
The goal should be to collect information you can trust.
Compare Yield Performance Across the Field
One of the most useful ways to evaluate harvest data is to look for spatial patterns.
Where were the strongest yields?
Where did production decline?
Were lower yielding areas scattered randomly, or did they follow recognizable patterns?
For example, lower yields might consistently occur on certain slopes, in poorly drained sections, along compacted areas, or within particular soil types.
These patterns don’t automatically identify the cause, but they give farmers a place to start investigating.
Over time, this can create a much better understanding of how individual areas within a field respond to different growing conditions.
Compare Multiple Years of Harvest Data
One season can be misleading.
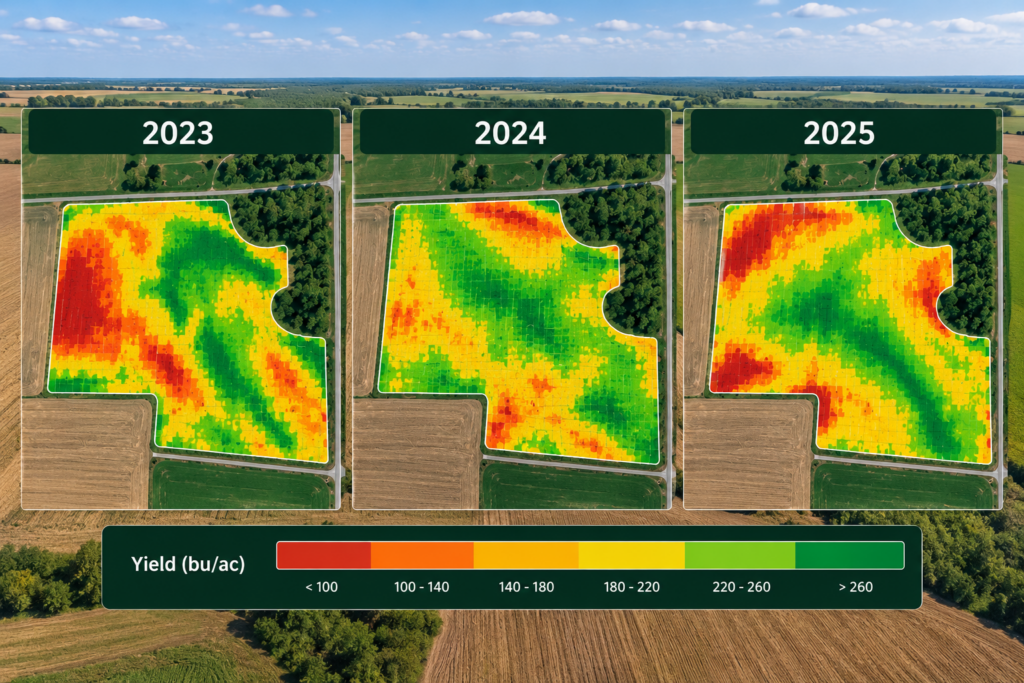
Weather alone can dramatically change how different parts of a field perform.
An area that struggles during an unusually wet season might perform extremely well during a dry year. Another area may consistently produce below the field average regardless of weather.
That is why historical harvest data can be particularly valuable.
University of Nebraska Lincoln Extension recommends using multiple years of yield maps because long term yield history helps prevent management decisions from being based too heavily on unusual conditions from a single season.
When similar patterns appear repeatedly, farmers have stronger evidence that the differences may reflect underlying field characteristics rather than temporary conditions.
Use Harvest Data With Soil Testing
Yield information becomes even more useful when combined with soil test results.
Suppose a section of a field consistently produces below average yields.
Soil testing might reveal low pH or nutrient limitations in that area. If nutrient levels appear adequate, the farmer may need to investigate other possibilities such as drainage, compaction, soil type, or another limiting factor.
On the other hand, high producing areas may remove more nutrients through harvested grain and require different fertility considerations.
Harvest data shouldn’t replace soil testing.
Instead, the two sources of information can complement each other and provide a more complete understanding of field conditions.
Improve Fertility Planning
Fertilizer decisions are one area where historical yield information may become particularly useful.
Crop nutrient removal is influenced by yield. Areas producing significantly different yields may therefore have different nutrient removal histories.
When harvest data is combined with soil sampling and agronomic recommendations, farmers can better evaluate whether uniform fertilizer applications make sense for a particular field.
In some operations, this information may contribute to variable rate fertilizer prescriptions.
However, yield alone should not determine fertilizer rates.
Soil tests, crop requirements, realistic yield expectations, previous applications, nutrient removal, and local agronomic recommendations all need to be considered.
Harvest data adds another valuable layer to that process.
Develop Better Management Zones
Not every acre within a field has the same production potential.
Precision agriculture allows farmers to divide fields into management zones based on characteristics that influence crop performance.
Historical yield maps can help identify those areas.
University of Nebraska Lincoln Extension notes that yield history can be used to establish spatially variable yield goals and evaluate whether site specific management may be appropriate.
A productive management zone might have different needs or economic potential than an area that consistently produces below the field average.
However, management zones should not be based on one colorful map.
The strongest zones are generally created using multiple layers of information, including several years of yield history, soil data, elevation, electrical conductivity, imagery, and field observations.
Evaluate Seeding Rates
Harvest data can also contribute to planting decisions.
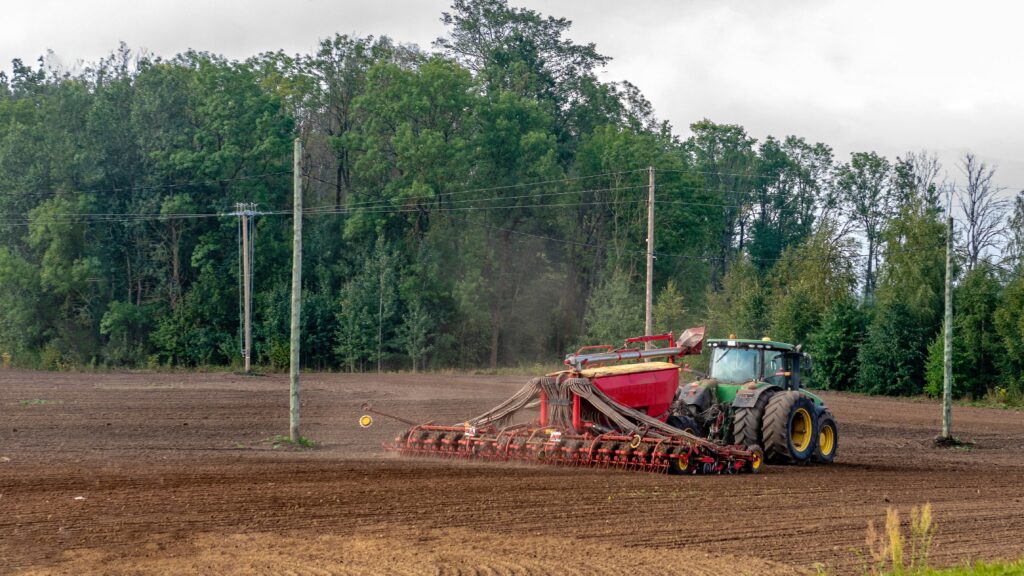
Some areas may have the productivity and resources to support higher populations, while other sections may not respond economically to additional seed.
Historical yield maps are one potential starting point when developing variable rate seeding management zones. Nebraska Extension notes that areas with consistent performance trends across multiple years can be particularly useful when developing these zones.
Farmers can then use field trials and check strips to evaluate whether different populations actually improve profitability.
This distinction is important.
The goal isn’t simply to produce the highest possible yield everywhere. The goal is to determine which management practices provide an economic return.
Evaluate Hybrid and Variety Performance
Harvest also provides an opportunity to evaluate seed decisions.
Farmers may compare the performance of different hybrids or varieties across similar field conditions.
However, comparisons need to be made carefully.
Soil type, planting date, population, weather, disease pressure, harvest moisture, and other factors can influence results. A higher yielding hybrid in one section of a field isn’t automatically superior if growing conditions weren’t comparable.
Iowa State University Extension recommends evaluating variety performance across multiple locations and trials rather than relying solely on one yield number.
Farm specific harvest data can still be valuable, particularly when it is collected consistently over multiple seasons and interpreted alongside other agronomic information.
Identify Drainage and Compaction Problems
Yield maps sometimes reveal patterns that correspond with physical field conditions.
Low areas that remain wet may show reduced yields during wet seasons. Compacted headlands or traffic areas may also produce recognizable patterns.
When these areas repeatedly appear in harvest data, farmers can investigate further.
The solution may involve drainage improvements, traffic management, targeted tillage, or another practice depending on the underlying problem.
The key is not assuming that every low yielding area needs additional fertilizer.
Sometimes the factor limiting production has little to do with fertility.
Evaluate Variable Rate Applications
Farmers already using variable rate technology can use harvest information to evaluate how those strategies performed.
For example, a farmer may compare yield results from areas receiving different seeding populations or fertilizer rates.
Check strips can be particularly valuable.
Nebraska Extension recommends incorporating check strips when evaluating variable rate seeding because they provide a comparison between the variable prescription and a consistent treatment across management zones.
Without a comparison, it can be difficult to determine whether a change in yield resulted from the prescription or from differences already present in the field.
Well planned trials turn harvest data into a much stronger decision making tool.
Look for Patterns Instead of Individual Numbers
Precision agriculture can produce an impressive amount of data.
That doesn’t mean every individual number deserves equal attention.
The most valuable information often comes from patterns.
Ask questions such as:
- Which areas consistently perform above or below average?
- Do yield patterns correspond with soil characteristics?
- Did wet or dry areas behave differently this season?
- Are certain management practices producing consistent results?
- Are low yielding zones improving over time?
- Are there areas where additional inputs aren’t producing an economic response?
These questions move the conversation beyond simply asking, “What did this field yield?”
Instead, the question becomes, “What can this field teach us?”
Clean and Organize Harvest Data
Raw yield monitor data may contain errors.
Turns at headlands, incorrect header position settings, grain flow delays, GPS errors, sensor problems, and other factors can create inaccurate data points.
University of Nebraska Lincoln Extension recommends processing yield information to remove erroneous points and account for grain flow delays before using maps for analysis.
Organizing data is equally important.
Field names, crop information, harvest dates, varieties, and other records should be stored consistently so they can be compared in future seasons.
A yield map sitting forgotten on a display provides very little value.
A well maintained history of field information becomes more useful every year.
Combine Harvest Data With Other Information
One of the biggest mistakes farmers can make is treating harvest data as a complete answer.
It isn’t.
Yield is the result of many interacting factors.
For better decision making, compare harvest information with other available data, such as:
- Soil test results
- Planting maps
- Fertilizer applications
- Crop protection records
- Field scouting notes
- Aerial imagery
- Soil maps
- Elevation
- Drainage
- Weather information
Layering information can help explain patterns that aren’t obvious when looking at yield alone.
For example, a low yielding section might line up almost perfectly with poorly drained soil. Another might correspond with a nutrient deficiency discovered through soil testing.
The more context farmers have, the more useful their harvest data becomes.
Avoid Making Major Decisions From One Season
It can be tempting to look at this year’s map and immediately change next year’s management plan.
Sometimes that makes sense, particularly when a clear and correctable problem has been identified.
Other times, waiting for additional information may be better.
One unusual weather event can dramatically influence yield patterns.
A single dry season, excessive rainfall event, disease outbreak, or planting problem may create patterns that don’t normally occur.
Historical information helps separate temporary events from consistent field behavior.
The University of Nebraska Lincoln recommends a longer yield history when evaluating spatial patterns because several years of information can provide a better foundation than a single season.
Turn Harvest Into the Beginning of Next Season
Harvest is often viewed as the end of the growing season.
From a precision agriculture perspective, it can also be the beginning of planning for the next one.
Iowa State University Extension emphasizes that harvest data can support future decisions involving fertility, hybrid or variety selection, variable rate planting, and other management practices when the information is collected accurately.
Once harvest is complete, farmers can review what worked, investigate what didn’t, and begin building next year’s management strategy.
That makes the combine more than a harvesting machine.
With properly calibrated precision agriculture technology, it also becomes one of the most important data collection tools on the farm.
Conclusion
Harvest data provides farmers with an opportunity to learn from an entire growing season. Instead of relying only on field averages, precision agriculture technology can reveal how crop performance varied from one part of a field to another.
When that information is accurate and combined with soil tests, planting records, fertilizer applications, field observations, and several years of historical information, it can help farmers make more informed decisions about fertility, seeding rates, management zones, drainage, field improvements, and variable rate applications.
The key is turning information into action. Collecting thousands of yield points isn’t useful if the data is never reviewed, cleaned, compared, or incorporated into future planning.
If you want to get more value from your harvest data or need help with yield monitoring, GPS guidance, displays, variable rate technology, or other precision agriculture solutions, contact us here. The team at L&D Ag can help you find technology that makes it easier to collect useful information and put it to work across your operation.
Further Reading
Iowa State University Extension: The Power of Accurate Yield Data
University of Nebraska Lincoln CropWatch: Yield Monitoring and Mapping
University of Nebraska Lincoln CropWatch: Harvesting Insights and Yield Monitor Data
University of Nebraska Lincoln CropWatch: Variable Rate Seeding Considerations
