
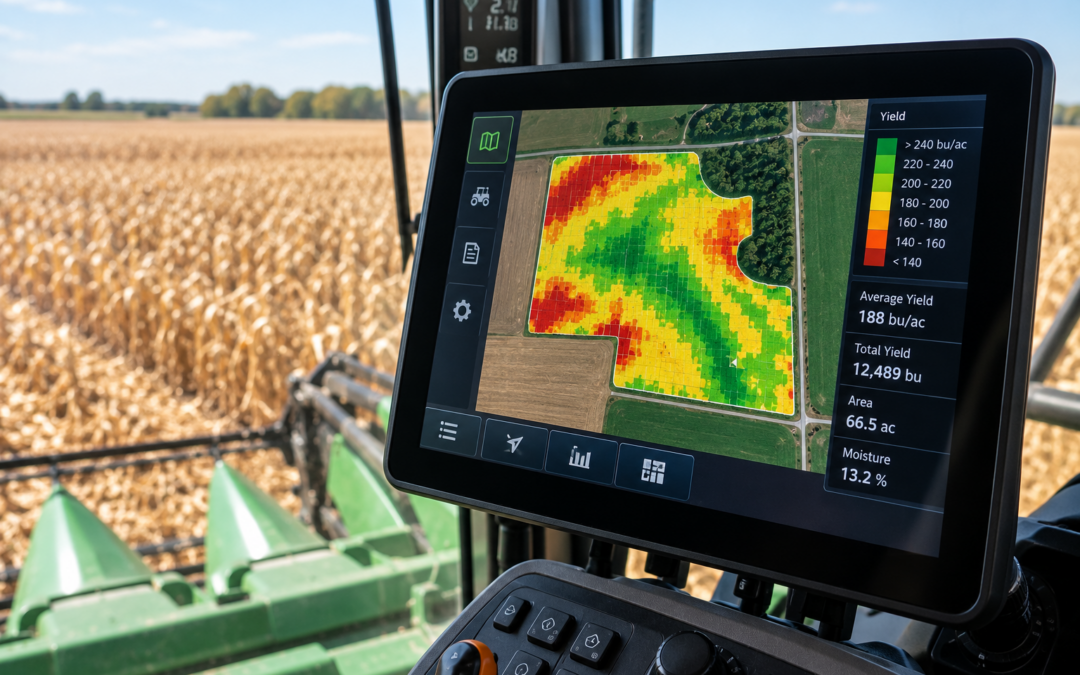
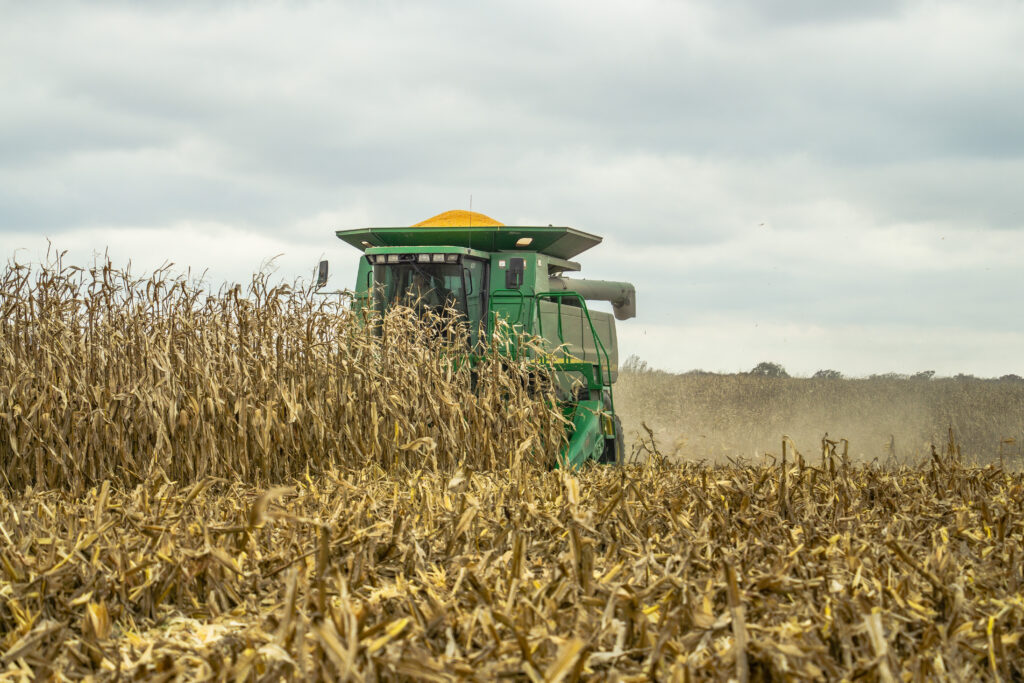
Modern farming generates an incredible amount of information, but some of the most valuable data is collected during harvest. As a combine moves through a field, precision agriculture technology can measure crop yield, moisture, location, and other information that helps farmers understand how different areas of a field performed.
Yield mapping takes this information and turns it into a visual representation of crop performance across a field.
Instead of simply knowing the average yield for an entire field, farmers can see where yields were higher, where they were lower, and how production changed from one area to another. When collected accurately and evaluated over time, this information can help guide fertility programs, seed decisions, variable rate applications, drainage improvements, and other management strategies. Iowa State University Extension notes that yield data can support decisions involving fertility planning, hybrid selection, and variable rate planting.
Understanding how yield mapping works is the first step toward getting more value from the information your equipment already collects during harvest.
What Is Yield Mapping?
Yield mapping is the process of collecting geographically referenced yield information during harvest and displaying that information on a map.
A yield monitoring system combines crop flow measurements with location information from GPS or another positioning system. As the combine moves through the field, the system continually records information and associates those measurements with specific locations.
The resulting yield map typically uses different colors or ranges to show variations in production throughout the field.
Rather than seeing one number representing the entire field, a farmer can identify patterns such as consistently high producing areas, lower yielding sections, and transitions between different productivity zones.
This spatial information is what makes yield mapping so useful.
How Does Yield Mapping Work?
Yield mapping relies on several components working together.
Depending on the combine and monitoring system, these may include:
- Yield or mass flow sensors
- Moisture sensors
- Ground speed information
- Header position sensors
- GPS receiver
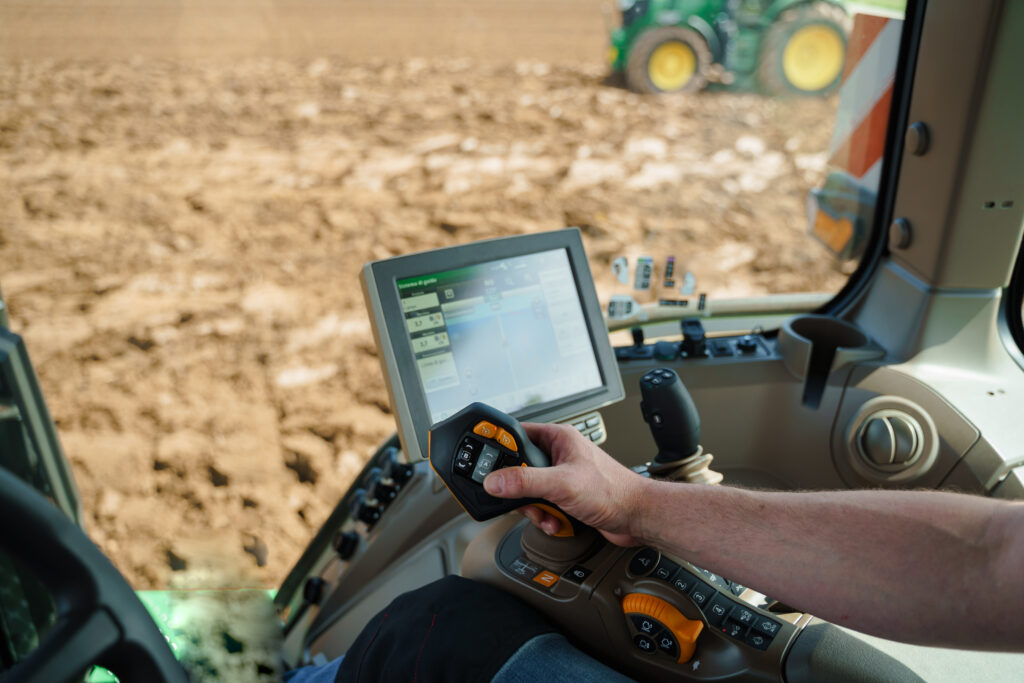
- In cab display
- Yield monitoring software
The yield monitor measures crop flow while GPS records where the machine is located. Moisture information helps account for differences in harvested grain moisture, while speed and header information help the system determine when and where crop is actually being harvested.
These measurements are combined to create geographically referenced yield data.
University of Georgia Extension describes yield monitoring systems as incorporating components such as crop flow sensing, ground speed, header position, GPS, and an in cab display.
Once harvest is complete, the collected information can be viewed and analyzed as a yield map.
Why Is Yield Mapping Valuable?
Every field contains variability.
Soil type, fertility, drainage, elevation, compaction, weather, pest pressure, planting conditions, and numerous other factors can affect crop performance.
A field average hides much of that variability.
Imagine a 100 acre field averaging 190 bushels per acre. That number sounds useful, but it doesn’t tell you whether the entire field produced close to 190 bushels or whether some areas produced significantly more while others produced considerably less.
Yield mapping allows farmers to see those differences.
That creates an opportunity to ask an important question:
Why did one part of the field perform differently from another?
Answering that question can lead to better management decisions.
Identify Consistently High Performing Areas
One of the easiest things to identify on a yield map is where crops performed well.
High yielding areas may be associated with favorable soil characteristics, better drainage, improved fertility, or other beneficial conditions.
When the same areas perform well year after year, that pattern becomes particularly valuable.
Farmers can compare these zones with:
- Soil tests
- Soil type maps
- Elevation data
- Planting records
- Fertilizer applications
- Previous yield maps
This can help identify characteristics that contribute to stronger production.
Find Areas That Consistently Underperform
Low yielding areas deserve just as much attention.
A low yield doesn’t automatically tell you what went wrong, but it provides a location where further investigation may be worthwhile.
Potential causes might include:
- Poor drainage
- Soil compaction
- Nutrient limitations
- Soil variability
- Weed pressure
- Disease
- Insect damage
- Stand establishment problems
- Weather related stress
Yield mapping helps narrow the search.
Instead of treating the entire field the same way, growers can investigate specific areas where problems repeatedly appear.
Compare Yield Maps Across Multiple Years
A single year’s yield map can be useful, but multiple years of data are often much more informative.
Weather conditions can dramatically influence crop performance during an individual growing season. A wet year may create problems in one part of a field while a dry year produces an entirely different pattern.
Comparing several years of yield mapping data helps distinguish temporary conditions from persistent trends.
If the same area consistently produces lower yields across multiple seasons and different weather conditions, there may be an underlying issue worth addressing.
Similarly, consistently productive zones may represent areas capable of supporting different management strategies.
Improve Soil Sampling Strategies
Yield maps can also provide another layer of information when developing soil sampling plans.
When yield patterns are compared with soil test results, farmers and agronomists may gain a clearer picture of what is happening across the field.
For example, an area with consistently low yields and low nutrient levels may suggest a fertility issue. However, low yields paired with adequate fertility could point toward drainage, compaction, soil characteristics, or another limiting factor.
Yield mapping doesn’t replace soil testing. Instead, it provides another source of information that can help put soil test results into context.
Support Variable Rate Applications
One of the most powerful uses for yield mapping is supporting variable rate management.
Variable rate technology allows farmers to change application rates as equipment moves through different areas of a field.
Depending on the operation and agronomic recommendations, this technology may be used for:
- Fertilizer
- Lime
- Seed
- Other crop inputs
Historical yield information can contribute to the development of management zones or prescriptions when combined with soil tests and other agronomic information.
This is where precision agriculture becomes especially valuable. Instead of assuming every acre has identical needs or production potential, farmers can use data to manage variability more deliberately.
Evaluate Management Decisions
Yield mapping can also help farmers evaluate decisions made earlier in the season.
Perhaps you changed a fertilizer program, adjusted planting populations, tried a different hybrid, or tested another management practice.
Harvest provides an opportunity to see how the crop responded.
Accurately collected yield data can help evaluate field scale treatments and management differences, although the quality of the comparison depends on proper calibration and comparable field conditions. Iowa State University cautions that yield monitor accuracy can be affected by crop conditions and that very small test plots may not provide sufficient precision for dependable comparisons.
Yield maps should therefore be viewed as one part of a larger decision making process rather than absolute proof that one practice caused a particular result.
Understand Drainage Problems
Water management can have a major impact on crop performance.
Yield mapping may reveal patterns associated with poorly drained areas, depressions, waterways, or other landscape features.
If low yielding zones repeatedly correspond with areas that remain wet after rainfall, additional investigation may reveal opportunities for drainage improvements.
Conversely, during dry seasons, different areas may emerge as the weakest performers.
Comparing those patterns over several years provides a more complete understanding of how water availability affects the field.
Use Harvest Data to Plan for Next Season
One of the greatest advantages of yield mapping is that harvest data doesn’t have to stop being useful when the combine leaves the field.
Information collected this fall can help guide decisions for next season.
Farmers can review yield maps alongside:
- Soil test results
- Fertilizer records
- Planting maps
- Variety information
- Application records
- Weather data
- Field observations
Together, these layers can provide a much clearer picture than any individual dataset.
The goal isn’t simply to collect more information. It is to collect useful information and turn it into better management decisions.
Accurate Yield Maps Start With Calibration
Yield mapping is only valuable when the underlying data is dependable.
An improperly calibrated yield monitor can produce inaccurate yield estimates and misleading maps.
Iowa State University Extension recommends calibrating yield monitors using accurate ground truth weights and, for systems requiring multipoint calibration, collecting calibration loads across different crop flow rates. Changes in crop moisture and other harvest conditions can also affect accuracy and may require recalibration.
Calibration should follow the manufacturer’s instructions for the specific monitoring system.
Taking time to calibrate correctly at the beginning of harvest can make a significant difference in the usefulness of the data collected throughout the season.
Monitor Sensors Throughout Harvest
Calibration isn’t the only consideration.
Sensors should also be inspected periodically throughout harvest.
Dust, crop residue, damaged wiring, loose connections, and mechanical changes can affect system performance.
Operators should monitor the display while harvesting and watch for unusual readings or sudden changes that don’t match actual field conditions. University of Georgia Extension recommends monitoring sensor readings and yield estimates during harvest to confirm that sensors are operating correctly and data is being recorded and mapped properly.
Catching a problem early may prevent acres of inaccurate information from being recorded.
Keep Field Data Organized
Good data management makes yield mapping much more valuable.
Fields should be named consistently, and harvest jobs should be assigned to the correct farm and field.
Creating separate harvest records for individual fields makes later analysis easier and reduces the risk of mixing information. University of Georgia Extension specifically recommends maintaining separate harvest jobs for individual fields to simplify later yield analysis.
Before harvest, growers should also consider backing up previous data so valuable historical records aren’t accidentally lost.

Don’t Make Decisions From One Map Alone
Yield maps are powerful tools, but they should be interpreted carefully.
A colorful map can make differences look dramatic even when the actual variation is relatively small. One season can also be heavily influenced by unusual weather or other temporary conditions.
The strongest decisions generally come from combining several sources of information.
Consider yield mapping alongside:
- Multiple years of harvest data
- Soil tests
- Field scouting
- Topography
- Drainage
- Input records
- Agronomic recommendations
The map tells you where something happened.
Additional investigation helps determine why.
That distinction is important when using precision agriculture data to make management decisions.
Yield Mapping Turns Harvest Into Information
Harvest has traditionally been the point when farmers measure the result of an entire growing season.
Precision agriculture adds another dimension.
Instead of only measuring how much grain came from the field, yield mapping shows where that production occurred.
That information can reveal patterns that aren’t obvious from the combine cab or from field averages.
Over time, these patterns can help farmers better understand their fields and make more informed decisions about how individual acres are managed.
Conclusion
Yield mapping gives farmers a detailed look at how crop production varies throughout a field. By combining yield monitor information with GPS location data, farmers can identify productive areas, investigate lower yielding zones, evaluate management decisions, support variable rate applications, and use harvest information to plan for future growing seasons.
The value of a yield map, however, depends heavily on the quality of the information behind it. Proper yield monitor calibration, functioning sensors, accurate GPS information, organized field records, and good data management all contribute to more dependable results.
When yield mapping data is combined with soil tests, field observations, application records, and several years of harvest information, it can become an important part of making informed management decisions.
If you want to get more value from your harvest data or need help with yield monitoring, GPS guidance, displays, precision agriculture equipment, or system upgrades, contact us here. The team at L&D Ag can help you find precision ag solutions that fit your operation and help turn field data into information you can actually use.
Further Reading
Iowa State University Extension: Tips for Calibrating Your Combine’s Yield Monitor
Iowa State University Extension: Keep Monitors, Sensors and Scales Accurate During Harvest
University of Georgia Extension: Cotton Harvest Considerations to Ensure Quality Yield Data
Iowa State University Extension: The Power of Accurate Yield Data
